Griddy works best when the request ends in something you can inspect: formulas in a range, a cleaned table, a native pivot, an editable chart, or a connected model.
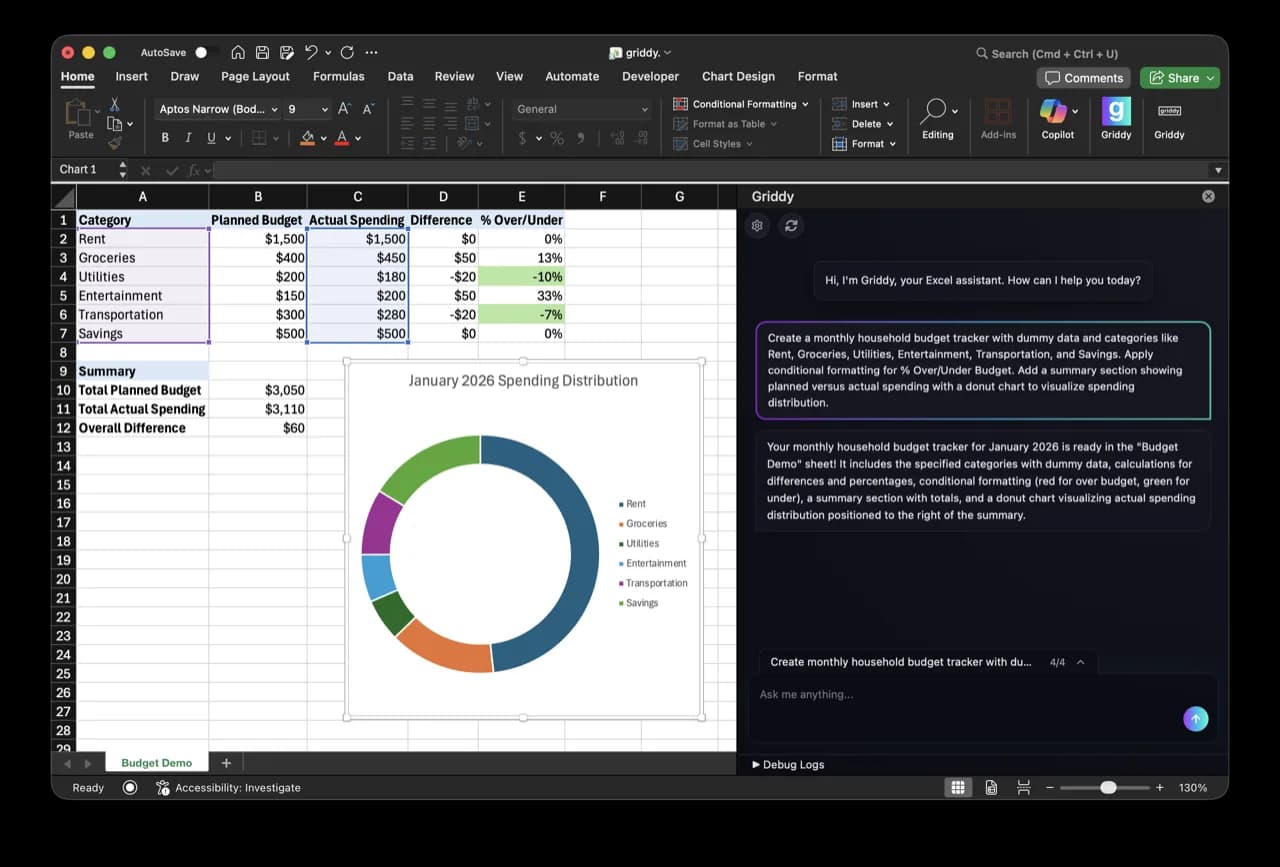
Real product screenshot: one request produced an editable budget table, linked summary, conditional formatting, and chart inside Excel.
01
Formulas
Write and repair formulas from a business rule
Name the source columns, target cells, rule, format, and edge cases. Griddy can place formulas into the spreadsheet, including cross-sheet references and filled ranges.
“In Summary!B2:B13, mirror Net Income from Monthly Sales!F2:F13 with formulas and format the results as currency.”
“Add a weighted forecast column using Deal Value times Probability, then fill it down without changing the source columns.”
What to verify
Lookups, conditional totals, date logic, ratios, and finance functions
Relative, absolute, and cross-sheet references
Formula repair with protected ranges and existing layout preserved
02
Data cleanup
Turn an export into a reliable working table
Coordinate several visible cleanup steps in one request: split columns, remove duplicates, trim whitespace, convert types, normalize values, and format the result.
“Create a PivotTable at H1 that summarizes total Revenue by Month from A1:F13 and leave the source block alone.”
“Build a pivot showing spend by Category and Owner, with SUM of Amount and a filter for the current month.”
What to verify
Native pivot creation in Excel, Google Sheets, and Griddy
Rows, columns, values, filters, names, anchors, and layout
Sum, count, average, minimum, and maximum aggregations
04
Charts
Create an editable chart tied to spreadsheet data
Name the source range, category and series fields, chart type, title, destination, and placement. Griddy creates or updates the chart object in the spreadsheet.